Overview
Performance Testing in TestGrid allows you to simulate user traffic on websites and web applications to evaluate system performance, scalability, and stability under varying load conditions. This guide walks through the complete workflow, from uploading test scripts and configuring load settings to analyzing execution reports and reviewing historical test runs.
Prerequisites
Before starting a performance test, ensure you have:
A valid JMeter (
.jmx) test script.Required test data files (
.csv), if referenced within the JMeter script.Access to the Performance Testing module.
Basic understanding of the load profile you want to simulate.
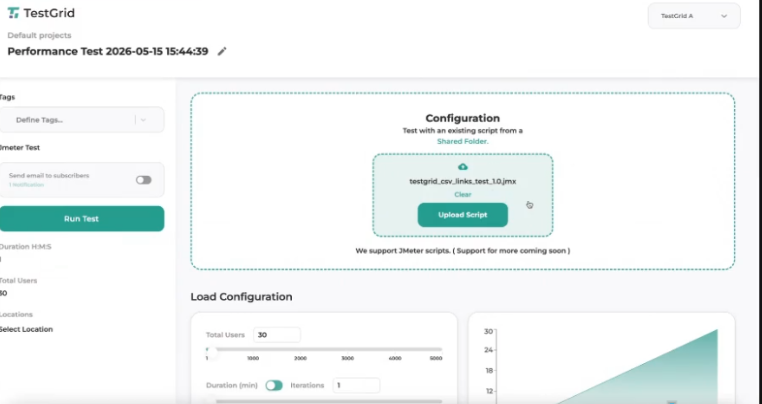
Part 1: Upload Test Scripts and Data Files
Step 1: Create a New Performance Test
Navigate to the Performance Testing module.
Click Create Test.
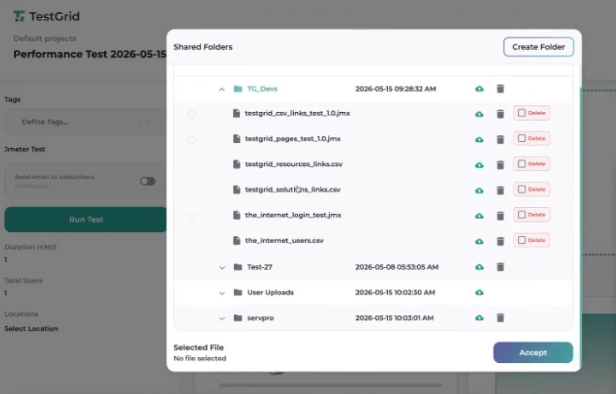
Upload your JMeter (
.jmx) script.Upload any associated data files (
.csv) required by the script.Click Accept to save the uploaded files.
Multi-File Upload Support
The platform supports uploading multiple .jmx and .csv files simultaneously, simplifying test setup for complex scenarios.
Step 2: Manage File Dependencies
If your JMeter script references external data files:
The corresponding
.csvfiles must also be uploaded.Missing dependency files will cause the test execution to fail.
Example
If your script uses:
${username}
and retrieves values from a CSV dataset, the associated CSV file must be uploaded.
Note
If the JMeter script does not reference external data files or variables, it can run independently without CSV uploads.
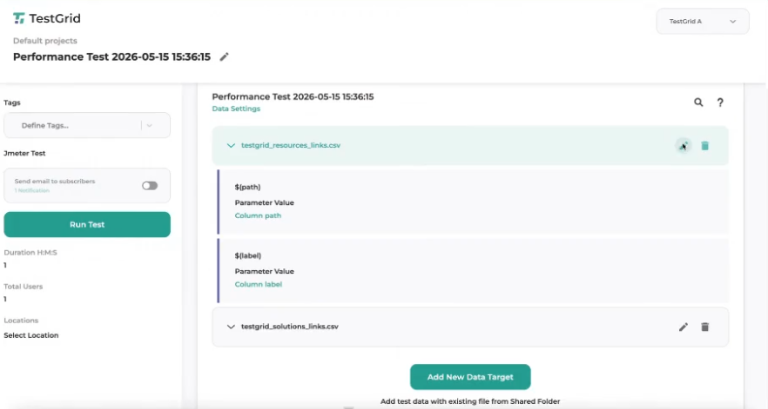
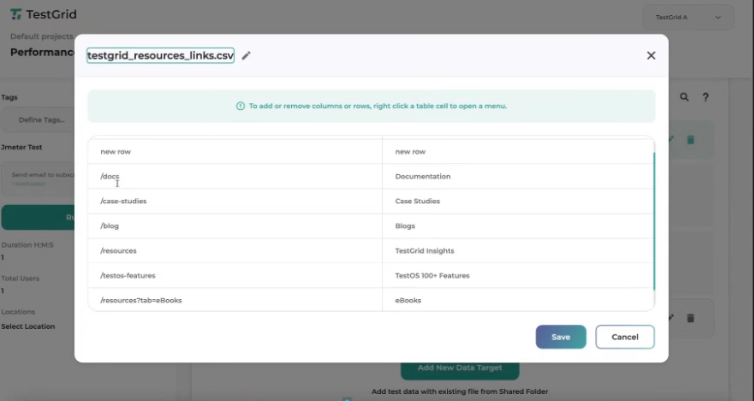
Step 3: Modify CSV Files Within TestGrid
CSV files can be edited directly within the platform.
Click the Edit (Pencil) icon next to the uploaded CSV file.
Review and update the data as required.
Add or remove rows and columns using the table options.
Click Save when finished.
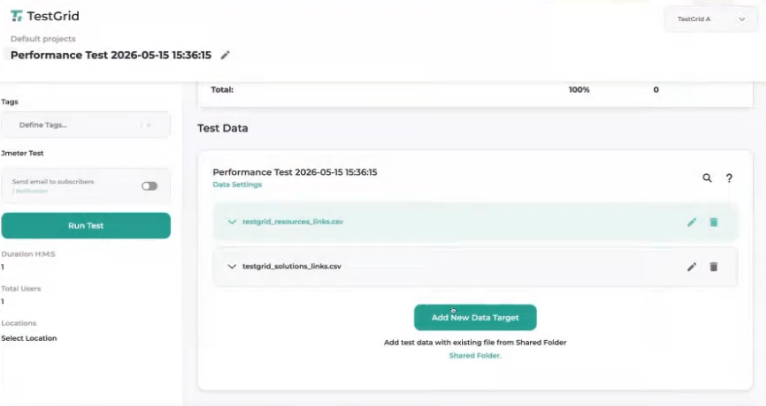
Changes are automatically linked to the test execution configuration.
After saving, your data targets are actively linked to the test. For example, you can link multiple targets at once, such as resource links and solution pathways.
Part 2: Configure Load Settings
Once the scripts and data files are uploaded, configure how traffic will be generated during execution.
Step 4: Configure Load Parameters
Specify the following execution parameters:
Total Users
The total number of virtual users that will access the application during the test.
Ramp-Up Time
Controls how quickly users are introduced during execution.
Instead of all users starting simultaneously, users are gradually added until the target user count is reached.
Example
Configuration:
Users: 30
Ramp-Up Time: 5 Minutes
Result:
Users are introduced gradually over five minutes until all 30 users are active.
Iterations
Defines the number of times the test scenario repeats during the execution.
Duration
Specifies the maximum execution time for the performance test.
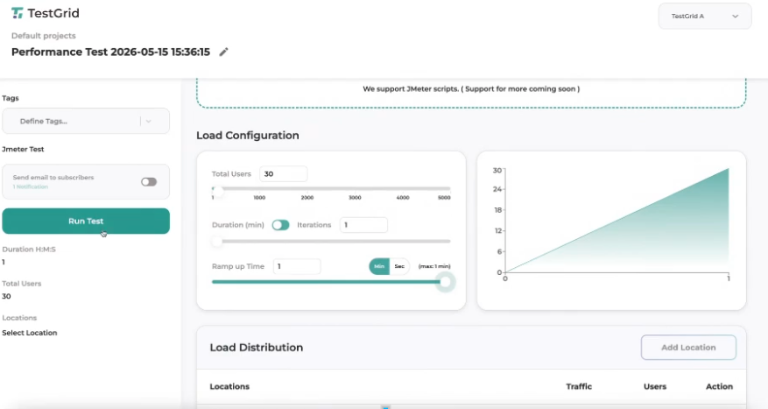
Step 5: Start the Performance Test
Review the configured load parameters.
Click Run Test from the left sidebar.
Wait for the execution to initialize.
Part 3: Monitor Execution and Analyze Results
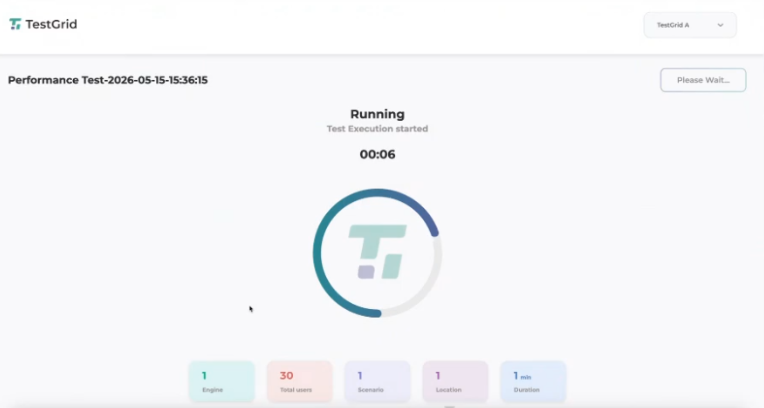
Step 6: Track Active Test Execution
Once execution begins, the platform displays a live execution dashboard.
The dashboard tracks:
Active Test Engines
Active Users
Scenarios
Execution Locations
Remaining Duration
These metrics update in real time throughout the execution.
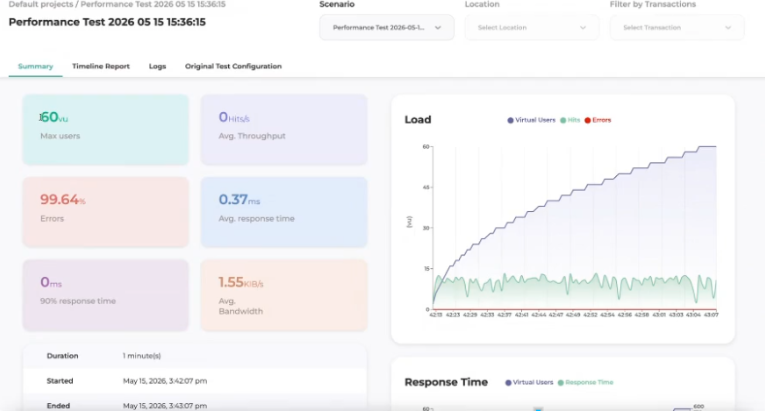
Step 7: Review the Performance Dashboard
After execution completes, TestGrid automatically generates a performance analytics dashboard.
Understanding Maximum Virtual Users (VU)
The displayed maximum virtual users may exceed the configured user count depending on your data configurations.
Example
Configuration:
30 Users
2 Active Data Configurations
Result:
Maximum Virtual Users = 60
Understanding Ramp-Up Graphs
Gradual increases or visible step patterns in the load graph indicate that the configured ramp-up settings were applied successfully.
These patterns are expected and confirm that users were introduced incrementally rather than simultaneously.
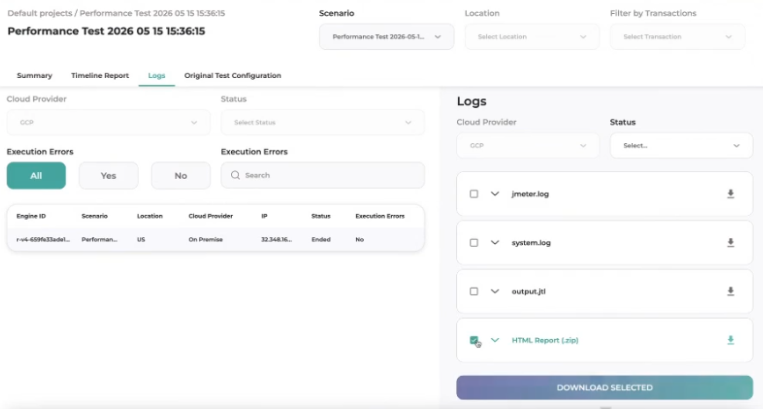
Step 8: Access Execution Logs and Reports
Navigate to the Logs tab to access execution artifacts.
Available downloads include:
| File | Description |
|---|---|
| jmeter.log | JMeter execution logs |
| system.log | Infrastructure and system events |
| output.jtl | Raw execution results including response codes, timestamps, and transactions |
| HTML Report (.zip) | Complete performance report package |
These files can be downloaded for further analysis and troubleshooting.
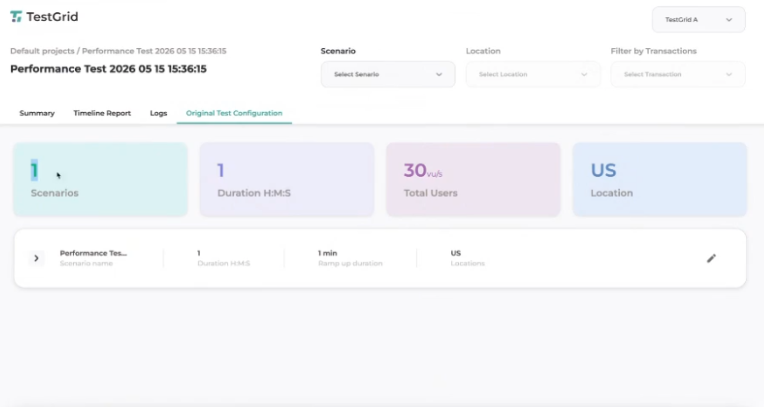
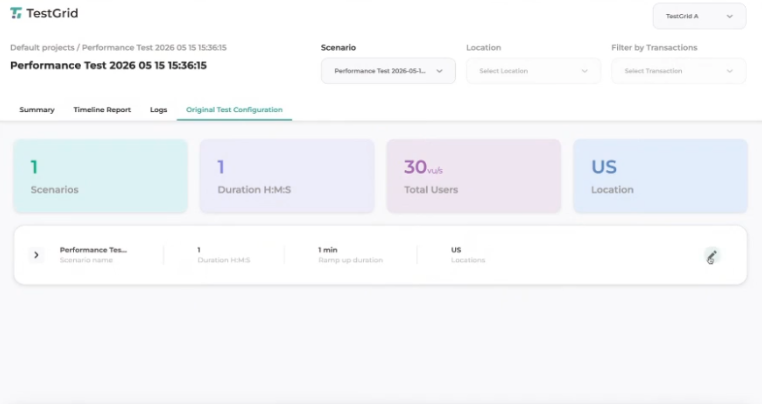
Step 9: Review Original Test Configuration
Navigate to the Original Test Configuration tab.
This section provides a permanent reference of the settings used during execution, including:
User Count
Ramp-Up Configuration
Duration
Scenario Configuration
Execution Locations
This helps validate and reproduce previous test runs.
Part 4: Re-run and Optimize Tests
Step 10: Modify Existing Tests
To update a previously executed test:
Open the Original Test Configuration tab.
Click the Edit (Pencil) button.
Modify the existing configuration.
Save the changes.
You can update:
Load settings
Duration
User counts
Data files
JMeter scripts
without recreating the test from scratch.
Step 11: Replace Test Scripts
If you want to reuse the same configuration but execute a different JMeter script:
Edit the existing test.
Upload a new
.jmxfile.Save the configuration.
Execute the test again.
This allows rapid comparison across different scripts while maintaining the same load profile.
Step 12: Configure Spike Testing
To simulate an immediate traffic spike:
Set:
Ramp-Up Time = 0
Result:
All configured virtual users start simultaneously when the test begins.
Example
| Users | Ramp-Up Time | Result |
|---|---|---|
| 500 | 0 | 500 users start instantly |
| 500 | 5 min | Users are added gradually over five minutes |
Part 5: Review Historical Test Runs
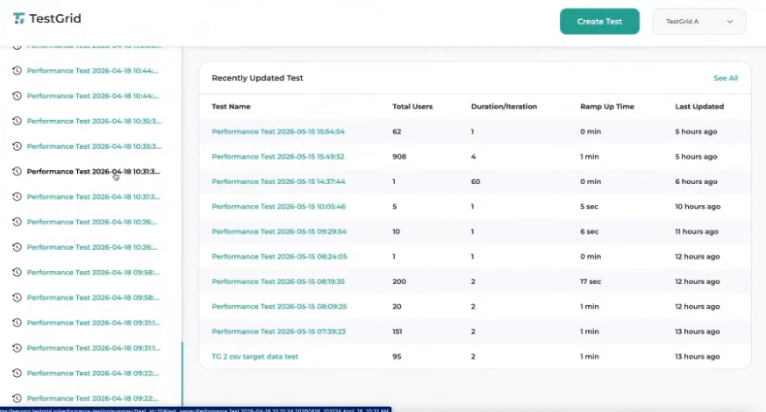
Step 13: View Test History
Navigate to the main Performance Testing Dashboard.
The Recently Updated Tests section displays:
Test Name
User Count
Duration
Ramp-Up Configuration
Last Updated Time
Click any historical test to view:
Performance reports
Execution logs
Original configurations
Analytics dashboards
Outcome
By following this guide, you can upload performance test scripts, configure realistic user loads, execute performance tests, analyze execution reports, download detailed logs, and compare historical test results to assess application performance and scalability.
Was this article helpful?
That’s Great!
Thank you for your feedback
Sorry! We couldn't be helpful
Thank you for your feedback
Feedback sent
We appreciate your effort and will try to fix the article